Case Study
Analysis - Mozambique Images and Data 1973, 1985, 1992, 1994, 1995
(downloaded 12Feb2008 from
http://earthshots.usgs.gov/Mozambique/Mozambique)
These
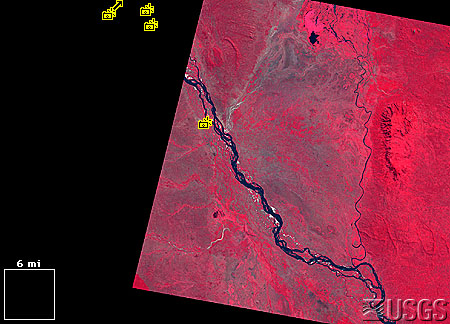
images center on the town of Mutarara, Mozambique, in southeastern Africa.
Look at
the false-color satellite images from 1973, 1985, 1992, 1994 and 1995. What can
you tell from them? It is hard to read the subtle changes, especially at this
scale. But in these years Mozambique was embroiled in civil war, and expert
interpretation of these images at full resolution reveals the war's effects.
|
 |
 |
|
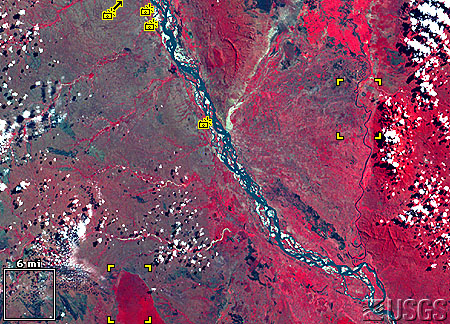
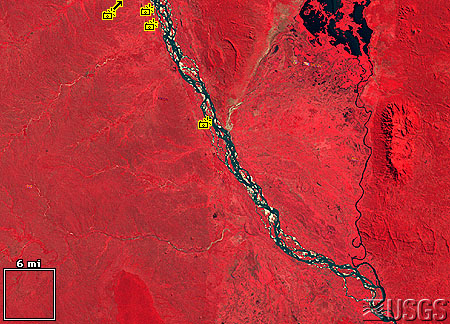
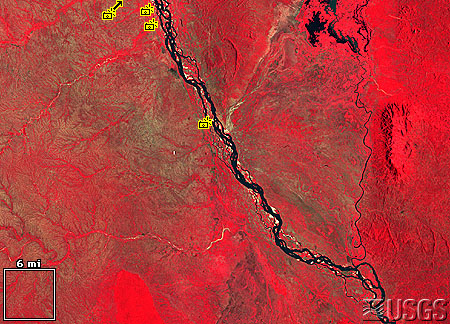
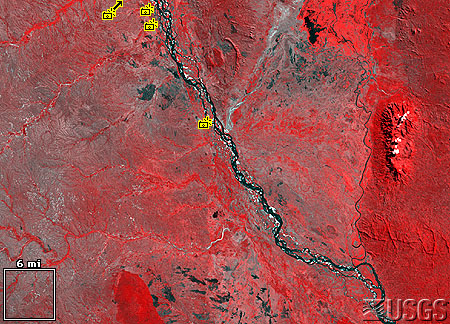
Preindependence: 15 Aug 1973, L1 MSS 4 2 1 |
Postindependence: 11 May 1985, L4 MSS 4 2 1 |
|
 |
 |
|
Peak displacement: 24
Feb 1992, L4 TM 4 3 2 |
|
 |
|
Above - Returnees: 28 May
1994, L5 TM 4 3 2
Left - Most recent: 20 Apr
1995, SPOT3 3 2 1 |
Mozambique: three decades of war
Mozambique
was a colony of Portugal until 1975, when an 11-year war of independence ended
with the establishment of an independent, Marxist government. But a 17-year
civil war started soon after independence, with an internal military uprising
that was supported by some foreign governments.
The civil
war affected Mozambicans severely, especially in rural areas. Hundreds of
thousands of people were killed. Over a million people fled the country,
especially to Malawi, and more than a million others were displaced within
Mozambique.1
Many rural people migrated to the cities, especially along the coast where the
government maintained control. The country went into severe economic depression.2
Agriculture was disrupted, so the country could not feed itself. By the late
1980s Mozambique had one of the lowest per-capita caloric intakes in the world.3
Mozambicans also suffered though an El Niño-related drought during the war's
last year, 1991-1992. This regional drought was especially hard on Mozambique.4
People were already malnourished, and had few resources to fall back on. Even
when relief food eventually flowed in from other countries, Mozambique's
war-ravaged transportation system prevented efficient distribution of the food,
and internal politics interfered with relief work. Mozambique was said to have
the highest "misery index" in the world, with 5 million of 16 million
inhabitants in need of food and medicine.5
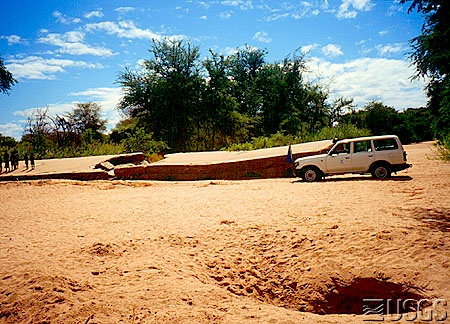
April 1995, bridge at the Sangadza River
The
streambed of this river is dry sand in this photograph. On the left, a group of
women and children is collected on the remnants of a bridge, apparently doing
laundry (they have a large yellow bucket). The hole in the foreground,
surrounded by footprints, is a hand-dug open well. The white vehicle with the
blue flag is carrying workers from the United Nations High Commissioner for
Refugees, who are assessing the reintegration of returning refugees.
Remote
sensing: early warning
The
U.S. Agency for International Development (USAID) runs the
Famine Early Warning System (FEWS), which monitors drought-prone countries
in Sub-Saharan Africa, to quickly detect droughts and crop failures which could
lead to mass hunger and starvation. FEWS was established in reaction to the 1984
Ethiopian famine, which most of the world learned about only when thousands of
people were already starving.
FEWS
personnel monitor rainfall, crops, grazing and markets on the ground, but they
also use satellite data to monitor large areas of cropland, by using maps of
NDVI (Normalized-Difference Vegetation Index). Healthy plants have the special
quality of absorbing visible sunlight to photosynthesize, but reflecting
infrared sunlight to keep cool. Therefore satellite data over a vegetated area
should have a large difference between the infrared and visible bands,
represented by a high NDVI value (here on a scale of 0 to 1). If the satellite
flies over croplands during growing season and "sees" a low level of NDVI, then
FEWS knows there may be a problem.
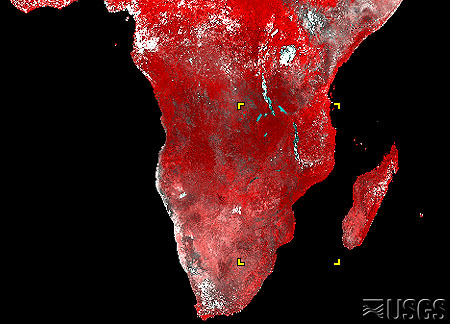
21-30 June 1992, NOAA 11 AVHRR bands 2 1 1
This is
what happened in Mozambique during 1991-1992. By January 1992, governments and
organizations in southern Africa described a looming food shortage so large that
many foreign governments and organizations had to send their own people to check
before they could believe it. This led to delays, and full-scale relief efforts
did not start until June or July. The "notable exception", according to one
African report, "was the Government of the USA which was able to verify the
anticipated severity of the drought through its USAID supported Famine Early
Warning System... [and] which took immediate action". U.S. grain shipments were
among the first to reach African ports.6
Remote
sensing: relief support
The U.S.
Geological Survey (USGS) Center for Earth Resources Observation and Science
(EROS) has supported FEWS since 1987, handling its satellite images and other
electronic data. These data are available through the
Africa Data Dissemination Service.
For the
1991-1992 crisis, EROS scientists made a map showing where crops had previously
been grown, to help assess the situation and target assistance. This Cropland
Use Intensity (CUI) map was created by an experienced satellite-image
interpreter drawing on large printed Landsat scenes, outlining areas with
similar levels of cropping. A high-CUI zone is 70-100% agricultural fields. The
lowest CUI category has 0-5% cropland. The photointerpreter used clues such as
color, texture, and context to estimate CUI. The prints were then converted into
the electronic map you see here.
1986-1988 estimated Cropland Use Intensity
Remote
sensing: historical documentation
In 1995,
three years after war ended, USAID asked the USGS to try documenting the
migration of rural Mozambicans during the civil war using Landsat and other
satellite data. These satellites cannot see people, but they can see farms; for
this reason, CUI was used again. In areas of subsistence agriculture, CUI
approximates population density. CUI can also be used to spatially disaggregate
agricultural statistics-- for example, if Sofala Province reports a 50% rise in
planted grains, CUI can tell us where in the province the grains were planted.
Using the
process outlined above, a small part of Mozambique was mapped for five different
times, representing various stages in the civil war. The CUI maps showed that
22% of the land was cropped before independence (1973). This dropped to 5% by
the end of the civil war (1992), and rebounded to 17% by 1995. These maps also
included administrative boundaries, towns, rivers and roads. The maps
distinguished mined roads, unmined roads, and demined roads (from December 1994
data; all roads were assumed to be unmined in 1973 and 1985, and any roads mined
or demined in 1994 were assumed to have been mined in 1992). This is an example
of how satellite data and other digitized data can complement each other when
juxtaposed.
(Read a
report on the making and interpretation of these maps – follows after the
Footnotes).
Footnotes
Thanks to
SPOT Image Corporation for use of the
20 April 1995 scene.
1. Mike
Sill, 1992, A geography of war: Geographical Magazine, November 1992, p. 45-50.
2. Steven
Kyle, 1991, Economic reform and armed conflict in Mozambique: World Development,
v. 19, no. 6, p. 637-649.
3. Sill,
1992.
4.
Southern African Development Community Food Security Technical and
Administrative Unit, 1993, Assessment of the response to the 1991/92 drought in
the SADC region: Harare, Zimbabwe, July 1993, p. 5.
5. Shawn
H. McCormick, 1993, Mozambique's cautious steps toward lasting peace: Current
History, v. 92, no. 574, May 1993, p. 224-228.
6. SADC,
1993, p. 8-9.
Other
references
Tom
Crawford, Ron Lietzow and Jim Verdin, 1996, 1995 Pilot Study; Cropland Use
Intensity Interpreted from Satellite Imagery of the Mutarara/Sena Area,
Mozambique: Hughes STX Corp. Center for Global Change newsletter, Vol. 3,
December 1996.
Kevin J.
Dalsted and Fred C. Westin, 1996, An overview and evaluation of cropland use
intensity in Africa: Sioux Falls, S.D., USGS EROS, Pecora 13 conference
proceedings, in press.
Harold D.
Nelson, ed., 1984, Mozambique; a country study: Washington, D.C., Foreign Area
Studies, American University.
Satellite
images
LM1179072007322790 (Landsat 1 MSS, 15 August 1973)
XF8F41030007061 (Landsat 4 MSS, 11 May 1985, held by the South African
station of the Landsat Ground Station Operations Working Group (LGSOWG))
LT4167072009205510 (Landsat 4 TM, 24 February 1992)
YFYF16772940528 (Landsat 5 TM, 28 May 1994, held by the
South African station of the Landsat Ground Station Operations Working Group
(LGSOWG))
31433859504200752001X (SPOT 3 HRV multispectral, 20 April 1995, courtesy of
SPOT Image Corporation)
Maps
Army Map
Service, U.S. Corps of Engineers, 1955 [compiled 1955 from 1939-1954 sources],
Salisbury: International Map of the World SE-36, edition 2, series 1301,
scale 1:1,000,000.
Mutarara/Sena CUI maps: U.S. Geological Survey, 1995, Mozambique Cropland
Use Intensity [1973-1995]: Sioux Falls, S.D., EROS.
Four-country CUI map: U.S. Geological Survey, 1992, Southern Africa Region
Cropland Use Intensity (CUI) [1986-1988]: Sioux Falls, S.D., EROS. Available
from the
Africa Data Dissemination Service (ADDS).
Four-country NDVI averages: U.S. Geological Survey, 1997, Normalized
Difference Vegetation Index (NDVI), Dekadal Average for Africa, ed. 1: Sioux
Falls, S.D., EROS. Available from the
Africa Data Dissemination Service (ADDS).
1995 Pilot
Study: Cropland Use Intensity Interpreted from Satellite Imagery of the
Mutarara/Sena Area, Mozambique
Tom
Crawford,
Hughes STX Corporation, U.S. Geological Survey (USGS) Center for Earth Resources
Observation and Science (EROS)
Ron Lietzow, Hughes STX Corporation, U.S. Geological Survey (USGS) Center
for Earth Resources Observation and Science (EROS)
Jim Verdin, U.S. Geological Survey (USGS) Center for Earth Resources
Observation and Science (EROS)
[This
article is reprinted from the HSTX Center for Global Change newsletter, Vol. 3,
December 1996, courtesy of the authors and Hughes STX Corporation. This file was
created by scanning and optical character recognition; some minor edits were
made for HTML compatibility.]
Background
In 1975,
after 11 years of war, Mozambique became independent of Portugal under a
single-party, Marxist-Leninist government. The new government began to
collectivize large farms that had been owned mainly by Portuguese farmers.
Following independence, however, economic conditions deteriorated, and in 1979
an armed, anti-communist rebellion began. Guerilla warfare engulfed Mozambique
and continued until a general peace accord was signed by the government (Frente
para a Libertacdo de Mocambique, FRELIMO) and the Resistenca Nacional de
Mocambique (RENAMO) in October 1992. Following the signing of the Rome Peace
Accord, and anticipating an end to a devastating regionwide drought, the first
wave of Mozambican refugees returned from Malawi between October 1992 and
January 1993. Some of the returnees planted, cultivated, and harvested crops
during this first postwar agricultural season. In 1993, the U.S. Agency for
International Development (USAID) began a program to rehabilitate transportation
infrastructure through land mine removal and road and bridge repair. In
addition, USAID continued a program to provide necessary inputs to agriculture,
such as seeds and tools, as well as food and other urgent assistance needed by
returnees and others affected by war and drought. Between 1992 and 1995, peace
was restored, more than 1.8 million refugees and nearly 4 million internally
displaced persons returned to their homes and farms, peaceful multiparty
elections were held, and economic activity-- particularly agriculture related--
increased.
In 1995,
USAID contacted the U.S. Geological Survey (USGS) to do a pilot study to
evaluate the usefulness of interpreting satellite imagery to document the return
of Mozambicans to the countryside around the towns of Mutarara and Sena near the
Zambezi River. Cropland Use Intensity (CUI) can be interpreted from satellite
imagery as an estimate of the percentage of land area used for cropping (Table
1). It has been used successfully in Africa for a number of applications.
Estimates of CUI have been employed as a surrogate for rural population density
by USAID's Famine Early Warning System (FEWS) project. In Mozambique, the FAO in
1985 prepared a Land Use Inventory of Mozambique, including CUI categories, that
showed high correlations between CUI and population density. The USGS has used
CUI in the Sahel to support interpretation of Normalized Difference Vegetation
Index (NDVI) images derived from Advanced Very High Resolution Radiometry (AVHRR)
satellite imagery and to spatially disaggregate agricultural statistics.
Table 1:
Characteristics of Cropland Use Intensity (CUI)
-----------------------------------------------------------------------------
How is CUI
expressed? Class Interval Middle value
1 70-100% 80%
2 50- 70% 60%
3 30- 50% 40%
4 5- 30% 20%
5 0- 5% 1%
Estimated Area
Cultivated: Product of polygon area and middle value.
Ideal Date of
Satellite Image: Early dry season, after harvest and before burning.
Key
Indicator: Contrast between cut fields and surrounding
vegetation.
Modifiers:
Alluvial, upland, and surface water.
Scales:
1:100,000 (1 cm = 1000 m, or 1 inch = 1.6 miles)
1: 50,000 (1 cm = 500 m, or 1 inch = 0.8 miles)
Selection of Satellite Scenes
The area
of the pilot study includes the towns of Mutarara and Sena in central Mozambique
and portions of the Zambezi and Chire Rivers. It is roughly centered on the town
of Sena (across the Zambezi River from the town of Mutarara) and encompasses
agricultural areas of interest to the east of Sena, between the Zambezi and
Chire Rivers and along the south side of the Zambezi River along the road to
Caia.
Figure
1
A sequence
of several steps was followed in carrying out the pilot study. First, cloud-free
images were selected from archived satellite images. The ideal time of year for
each of the images is early in the dry season, after harvest and before burning.
In Mozambique, this period falls in April and May, when there is good contrast
between the cut fields and still-standing adjacent, noncrop vegetation. Five
time periods were targeted, corresponding to contrasting biophysical and
socioeconomic conditions in the study area (Table 2).
Table 2: Target time
periods
----------------------------------------------------------------------------
April/May 1975
Cultivation patterns before independence on July 25, 1975.
April/May 1985
Following departure of colonial companies, creation of state-owned farms,
"villagization" program, and other postindependence agriculture policies; but
before widespread war-related destruction and depopulation, which began in 1986.
April/May 1992
Near-maximal population displacements due to civil war and drought, preceding
the October 1992 Peace Accord.
April/May 1994 Postwar
land use patterns affected by cessation of hostilities, influx of refugees,
greater rainfall, and removal of land mines from roads. Second harvest since
Peace Accord and USAID rehabilitation activities.
April/May 1995 Most
recent harvest following end of major return migrations of refugees and
displaced persons. USAID-sponsored land mine removal and rehabilitation support
continue.
Catalogs
of archived, satellite imagery acquired by Multispectral Scanner (MSS) and
Thematic Mapper (TM) sensors on Landsat satellites, and by Multispectral (SX)
sensors on the Systeme Probatoire d'Observation de la Terre (SPOT) satellites,
were searched for cloud-free scenes. Images that were cloud free or nearly cloud
free were located for 1973, 1985, 1992, 1994, and 1995 for the area of interest
(see Figure 1) for the dates shown in Table 3. It was not possible to obtain a
cloud-free scene for the April/May period for 1973 and 1992.
Table 3:
Available Satellite Imagery
Date Sensor
Res. Extent, km Conditions
--------------------------------------------------------------
15 Aug 1973 MSS
80 m 180 x 180 Preindependence
11 May 1985 MSS
80 m 180 x 180 Postindependence
24 Feb 1992 TM
30 m 180 X 180 Peak Displacement
28 May 1994 TM
30 m 180 X 180 Returnees
20 Apr 1995 Xs
20 m 60 x 60 Most Recent
MSS = Landsat
Multispectral Scanner
TM = Landsat Thematic
Mapper
XS = SPOT
Multispectral
The digital data for these five scenes were geocorrected and then printed at
scales of 1:100,000 for MSS and TM, and 1:50,000 for SPOT on 40" x 40" (102 cm x
102 cm) paper. False color (red) was used to indicate response in near infrared
wavelengths, which is especially useful for discriminating different vegetative
cover types.
Cropland
Use Intensity (CUI) Estimation
An
experienced satellite image interpreter delineated zones of CUI with ink on
mylar overlays for the satellite image prints. Cues including color, texture,
and context were used to define the zones of relatively homogeneous level of
cultivation. The landscape was also divided into major regions-- alluvial,
upland, and surface water. The mylar manuscripts were then digitized to create
the information "layers" used in a geographic information system.
Geographic
Information System (GIS) Analysis
The
analyst and GIS Data Management Specialist created data layers to indicate the
location of towns, roads, and hydrographic features in the area of interest. An
information layer for the roadway network was used to provide context to the CUI
findings, and information of December 1994 was used to indicate road
rehabilitation activities that have taken place. Techniques of GIS overlay
analysis were employed to quantify the differences in CUI over the five dates
chosen for the pilot study.
Figure
2
Results:
Study Area CUI -- Four Maps
The study
area includes 1,078,031 hectares, or 10,780 sq km (Figure 2). The Mozambique
Cropland Use Intensity map of August 15, 1973, indicates 30-50 percent CUI in
most of the area in an approximately triangular zone defined by Sena,
Tembe-Tembe, and Caia, and in an area south of the Zambezi River between Sena
and Caia. With few exceptions on that date, CUI is 30 percent or less in the
remaining portions of the study area. Overall, about 16 percent of the study
area was cultivated on August 15, 1973, a time during which there were still
large colonial agricultural activities operational but during which there may
have been some guerilla activity in the area.
In May
1985, the amount of cropped area is estimated to have been 43 percent of the
area cropped in 1973. Ten years after independence, collective farms had been
established and guerilla warfare was being conducted by RENAMO in the study
zone. Cropland Use Intensity was generally reduced to between 5 and 30 percent
in areas where CUI had been in the range of 30-50 percent before independence
(August 15, 1973). On May 11, 1985, large areas that in 1973 were cultivated
between 5 and 30 percent were apparently uncultivated. It is notable that there
was a substantial amount of open water along the Chire River just south of
Malawi on May 11, 1985, in contrast to the smaller lakes in the same area on
February 24, 1992, and even less standing water on the study dates in 1973,
1994, and 1995. Although there was apparently abundant water during the 19841985
cropping season, the civil war had continued since 1979, and it is possible that
both postindependence agricultural practices and conflict in the area
contributed to the reduced area cropped as of May 11, 1985.
By
February 24, 1992, the Mozambican civil war had been waged for about 15 years.
There had been major displacement and isolation of the population of the study
area due to armed conflict, mining of roads, and sabotage of other
infrastructure within the study area. The area was also hard hit by the
1991-1992 drought, which drove many people from their homes in search of food
and water and seriously reduced crop production even for those who remained. The
CUI interpreted from the TM scene of that date indicates only between 4 and 5
percent of the study area being cultivated, with very few, small areas 30
percent or more cultivated.
Following
the signing of the Peace Accord in October 1992, refugees and displaced persons
moved back into the study area, removal of mines began, inputs to agriculture
(e.g., seeds and tools) began to be supplied to local people, and the normal
agricultural rains arrived. The CUI interpretation of the May 28, 1994, TM scene
indicates that the percentage of the study area under cultivation increased to
about 10 percent. Most of the areas cropped between 30 and 50 percent on May 28,
1994, were west of the Zambezi River.
Analysis
of the Mozambique Main Study Area shows a trend of decreasing crop production
there from 1973 through 1992, the year in which the civil war ended. In
comparison to CUI in the study area on February 24, 1992, 9 months before the
Peace Accord was signed, CUI interpretation indicates that crop production had
doubled 19 months after the Peace Accord was signed. Key factors in the increase
in cropland use intensity are that the drought had ended, farmers had reentered
the country, land mines were being removed, and inputs to agriculture were being
contributed by donors.
Figure
3
Results:
Substudy Area CUI -- Five Maps
Figure 3
focuses on a portion of the larger study area, the "substudy area," as defined
by the smaller SPOT scene. The substudy area encompasses 253,756 hectares (about
50 km x 50 km, or one quarter of the 1,078,031-hectare study area). Twenty-two
percent of the substudy area was cultivated in 1973, whereas only about 9
percent of the substudy area was estimated to have been cultivated as of May 11,
1985. During the 1991-1992 drought, and during one of the last months of the
civil war, only 4 percent of the substudy area was estimated to have been
cultivated. CUI interpretation of the February 24, 1992, subset of the TM scene
covering the same area as the SPOT scene reveals that the conditions of warfare,
mined roads, and drought resulted in very little crop production. As of May 28,
1994, hostilities had ceased, many of the roads in the substudy area had been
cleared of land mines, refugees and displaced persons had returned, and
development assistance and food aid were being provided by USAID and other
donors. Agricultural production had increased to include 10 percent of the
substudy area.
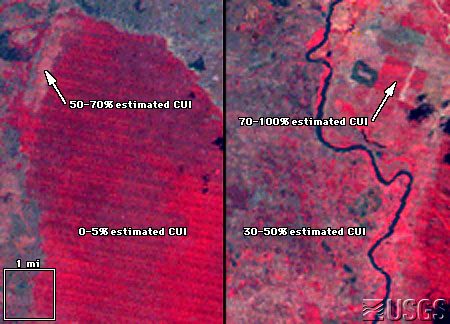
The CUI
interpretation of the SPOT scene of April 20, 1995, shows about 17 percent of
the substudy area under cultivation. The trend is clearly one of increase in
crop production following the signing of the Peace Accord of October 1992. In
April 1995, relatively intense cultivation (50-70 percent) is evident in some
portions of the substudy area, south of the road between Sena and Tembe-Tembe.
Figure
4
Figure 4
depicts a decrease in cropped area within the study area subset, which includes
an area approximately 50 km x 50 km, followed by an increase. Using the CUI
interpretations of the five satellite images makes it possible to determine a
general pattern of decreasing crop production, followed by increasing crop
production. It is clear that crop production was severely decreased as a result
of drought and effects of war, such as migration out of the area. Following the
signing of the Peace Accord, it appears that crop production in the study area
subset is increasing rapidly. This should result in improved nutrition of local
people and increased demands for inputs to agriculture and transportation
infrastructure (roads and vehicles) to ship agricultural products to markets
outside the area.
Figure
5
Results:
Change in Agricultural Intensity -- Two Maps
Between
August 15, 1973, and February 24, 1992, crop production decreased in most of the
study area subset, but there were increases in cropland use intensity in some
areas west of the Zambezi River. Between February 24, 1992, and April 20, 1995,
increases in cropland use intensity are evident along the Zambezi River and in
alluvial soils associated with watercourses in the area. Decreases in cropland
use intensity between 1992 and 1995 are seen in few, small, and scattered areas
throughout the study area subset.
The
changes in the intensity of cropping between February 24, 1992, and April 20,
1995, are, for most of the study area subset, increases. There are during that
period, however, some portions of the study area subset for which cropland use
intensity decreased. The reasons for decreases in CUI in some parts of the study
area subset, in which overall there is a net increase in CUI, are not clear. It
could be that marginal lands that had been cultivated were abandoned upon the
cessation of hostilities in favor of more productive lands, or that as the peace
holds over time, production areas shift from more isolated to more
market-accessible locations.
The
detailed map of the study area subset showing change in agricultural intensity
between August 15, 1973, and February 24, 1992, also shows road status as of
December 1994. It is assumed that all roads in the study area, which were
indicated as Mined, De-Mining in progress, or De-Mining completed, were mined on
February 24, 1992, 8 months before the Peace Accord was signed. Most of the
area, and particularly the portions adjacent to mined roads, shows a substantial
reduction in the use of the land for agriculture. There are notable exceptions
in the westernmost parts of the scene. These areas, which historically did not
contain any medium or large population centers, may have been more secure from
land mines and isolated from hostilities than other parts of the study area.
In
contrast, the scene representing change in agricultural intensity in the study
area subset between February 24, 1992, and April 20, 1995, shows increases
almost everywhere in the substudy area. Relatively large increases in cropland
use intensity are evident in the area bounded by Charre, Sena, Tembe-Tembe, and
the confluence of the Zambezi and Chire Rivers. The roads cleared of land mines
as of December 1994 are also indicated, suggesting that removal of mines has
been a major factor in enabling the inhabitants of the area to recommence crop
production.
Conclusion
The use of
cropland use intensity interpretation of satellite imagery of a portion of the
Zambezi River Valley at different times over a period of 22 years shows dramatic
differences in utilization of the land for agriculture. The devastating effects
of war in virtually eliminating crop production in the study area are evident in
maps derived from the interpretation of satellite imagery. On a brighter note,
results of the October 1992 Peace Accord and subsequent assistance by USAID and
other donors are evident in increased cultivation of land, the basis for
economic activity in the study area. Periodic analysis of satellite images in
the future can yield information about location of agricultural production and,
with appropriate ancillary information, location of population.